How to Spot Market Manipulation Accumulation Phase Before Breakout
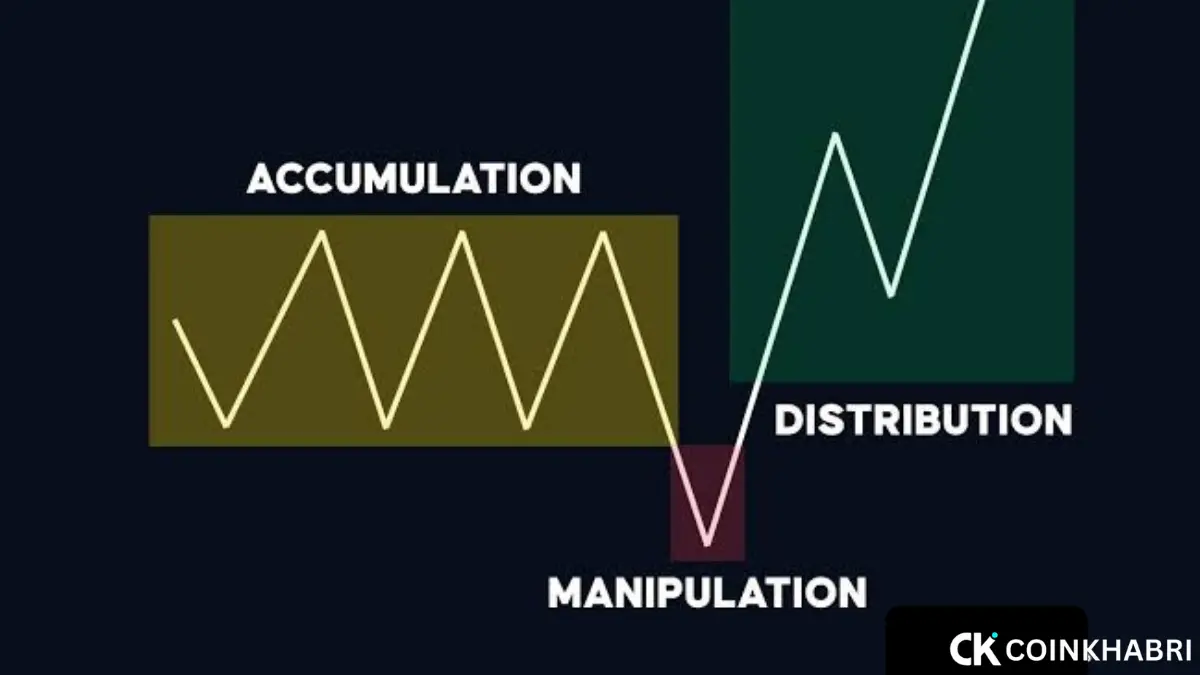
You must have noticed that whenever you buy a crypto coin, it keeps moving sideways for a whole week. Then, out of frustration, you sell that coin. A few days later, when you check that same coin, it has gone up by 40% to 50%.
You get very angry, but this method is used by institutional players and heavy whales to trap you in the Manipulation Accumulation Phase. This happens because they do not want retail investors to make money; that is their biggest motive.
Well, this whale or Manipulation Accumulation Phase typically lasts for at least two weeks so that all spot users sell their coins, and then the whales or institutions pump the coin.
However, if you are reading this guide on the Coinkhabri website, today I am going to tell you a method through which you can identify the Manipulation Accumulation Phase of any coin, buy at the exact right time, make a good profit, and get hidden knowledge that you probably have not found in any previous guide.
What is the Accumulation Phase?
The accumulation phase is the time when big players — whales, market makers, or institutions — slowly buy an asset without pushing the price up too fast. The goal is simple: gather as many coins as possible at the lowest average price, and keep retail traders from noticing so the price rally doesn’t start too early.
This concept comes from the Wyckoff Method, which Richard Wyckoff developed a century ago, and it is still considered one of the most reliable frameworks for reading crypto and stock charts. According to Wyckoff, every market cycle goes through 4 stages:
- Accumulation: Smart money quietly buys at a low price.
- Markup: The price breaks out, and retail traders joining in create an upward trend.
- Distribution: Smart money sells their coins to meet retail demand.
- Markdown: The price drops when the crowd realizes they bought late.
Understanding which stage the market is currently in can be the biggest edge for any retail trader. If you want to understand the price structure thoroughly before looking at signals, it is also important to learn how to do good fundamental analysis, because accumulation only happens when there are real reasons behind the asset.
Why Does Manipulation Happen During the Accumulation Phase?
Whales or market makers cannot buy millions of dollars worth of coins in a single transaction without moving the price violently. Therefore, they use tactics that keep retail traders confused, fearful, or disinterested until they build their positions. Here are some of their common methods:
- Fake breakdown (stop hunt): The price goes below an important support level to trigger retail stop-losses and cause panic selling, and then quickly reclaims above that level once weak hands exit.
- Suppressed volatility: Large buy or sell walls are used to keep the price in a tight range and discourage both breakout traders and short sellers.
- Narrative silence: Smart money prefers coins that nobody is talking about. Low social hype and low search interest are often signs that quiet accumulation is happening.
- Absorption of sell pressure: Whenever retail sells in a panic, a large buyer secretly absorbs that supply without letting the price drop more than intended.
In most cases, this is not illegal — it is simply the way large capital enters the market without paying a premium. Your job is not to stop this, but to recognize it in time so that you take a position along with it instead of fighting against it.
8 Signs of the Accumulation Phase Before a Breakout
Now I am going to tell you that whenever an accumulation phase happens, you can see 8 signs in it, which will let you know before a breakout that accumulation is happening and what we should do now.
1. Long and Tight Sideways Range
The most basic sign is that the price keeps trading in a horizontal channel for a long period—often weeks or months—instead of trending. The difference between genuine indecision and a forgotten coin is that in an accumulation range, the floor (support) remains strongly established despite heavy sell pressure.
2. Decreasing Volatility (The Squeeze)
As accumulation matures, daily price swings keep decreasing. Bollinger Bands narrow down, and the Average True Range (ATR) comes down to multi-week lows. This “squeeze” happens because large buyers are absorbing volatility on both sides. A volume spike after a volatility squeeze is considered one of the most reliable breakout signals in technical trading.
3. Volume Behaving Differently Than Price
This is where most retail traders get tricked because they only look at the price. Keep an eye on these things:
- Volume is increasing on green (up) candles inside the range, and volume is decreasing on red (down) candles.
- Sometimes volume spikes but there is not much movement in the price—this is a classic sign that large orders are being absorbed quietly.
4. Wyckoff Spring
Near the end of accumulation, the price often suddenly drops below the range support, triggering stop-losses and shorts, and then snaps back above the support within a few candles. This “spring” flushes out the final weak hands before the markup begins. If you see a sharp wick on high volume below support, and then an immediate reclaim, this is a strong accumulation signal—not bearish.
5. Order Book and Order Flow Clues
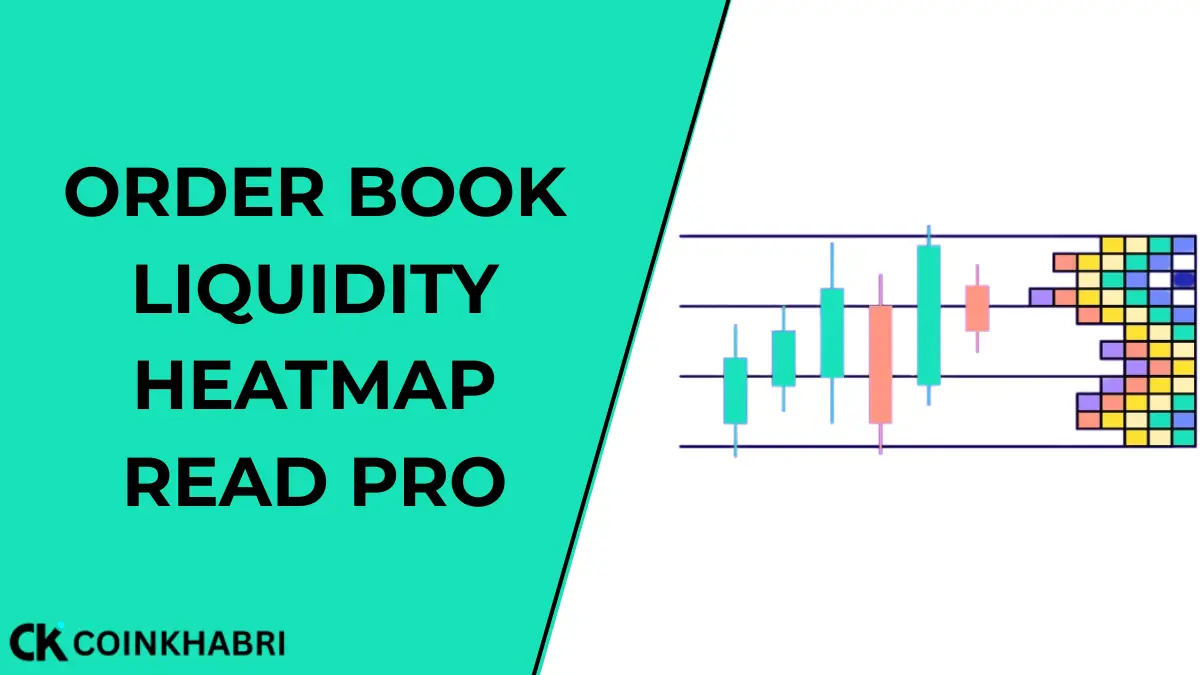
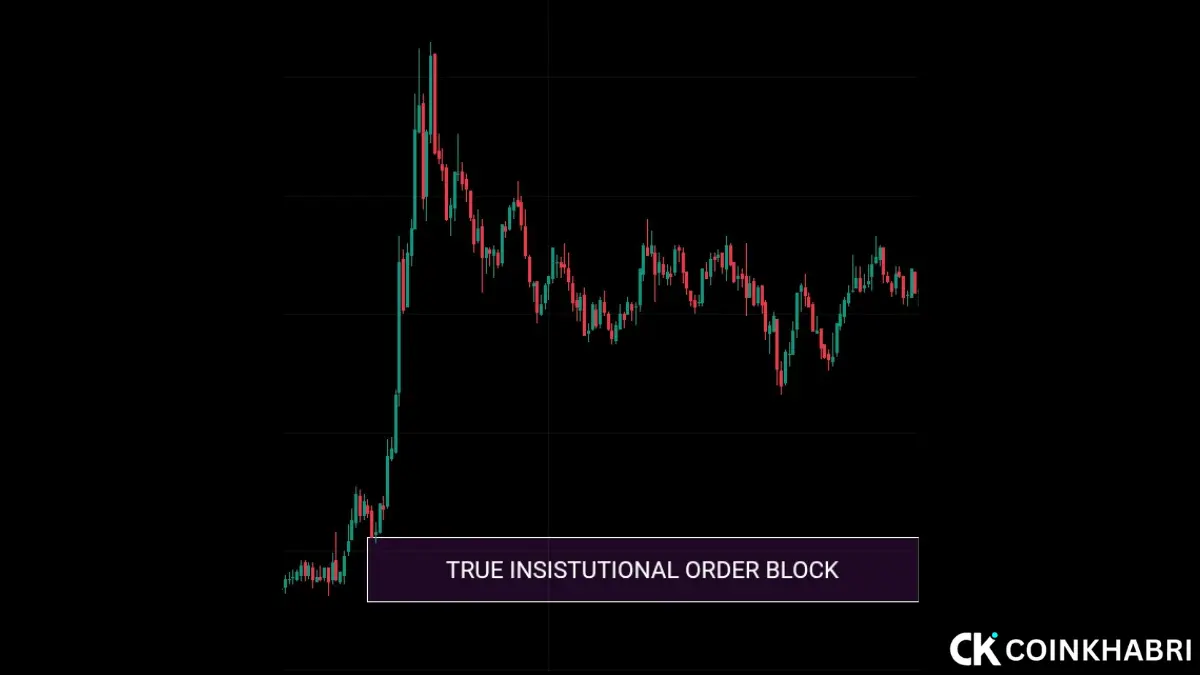
Large, persistent buy walls in the order book that appear repeatedly at the same price level even if they get partially filled—this is a strong tell. This is directly connected to reading institutional footprints, which is why it is necessary to learn how to distinguish real institutional order blocks vs fake ones—this skill pairs perfectly with identifying an accumulation range.
6. On-Chain Accumulation Data
For coins that have visible on-chain data, keep an eye on these:
- Exchange net outflows: Coins moving out of exchanges often mean holders are transferring them to cold storage, not preparing to sell.
- Whale wallet growth: A steady increase in the number of wallets holding large balances, even if the price remains flat.
- Dormant supply staying put or sleeping: Long-term holders not selling during dips is a bullish accumulation signal.
7. RSI or MACD Divergence
When the price stays flat or makes a lower low, the RSI or MACD histogram often prints a higher low. This bullish divergence gives a sign of weakening sell pressure even if the price does not confirm it yet—this is a classic early accumulation fingerprint.
8. Falling Bitcoin Dominance or Sector Rotation
Sometimes accumulation in altcoins matches with capital quietly rotating from Bitcoin. Studying how Bitcoin dominance affects altcoins can let you know which sector is being accumulated quietly before a big altcoin rally.
Step-by-Step Checklist Before Entry
- Confirm that the price has been range-bound for at least several weeks, not just a few days.
- Check that volatility (ATR/Bollinger Bands) has visibly compressed.
- Observe that volume increases on up-moves and decreases on down-moves.
- Look for a spring — a sharp wick below support followed by a fast reclaim.
- Confirm on-chain outflows or whale accumulation, if data is available.
- Check for bullish RSI or MACD divergence against the price.
- Enter only when the price closes back above the range support/resistance with volume confirmation — do not try to front-run the spring itself.
- Set your invalidation level before entering and calculate your position size properly; if you want to trade this setup with leverage, it is important to understand how to manually calculate your liquidation price.
Conclusion
Recognizing the Accumulation Phase before a breakout is less about predicting the future and more about seeing what big players are already doing through volume, order flow, on-chain data, and price structure, which is happening right in front of everyone. Combine this with solid fundamental analysis, sentiment tracking, and proper risk management, and you transform from the retail trader who buys on the breakout candle into the trader who is already positioned before the breakout even happens.