How Find True Institutional Order Blocks in Crypto Trading
If you do crypto trading, you must have heard the name “order block” in trading.
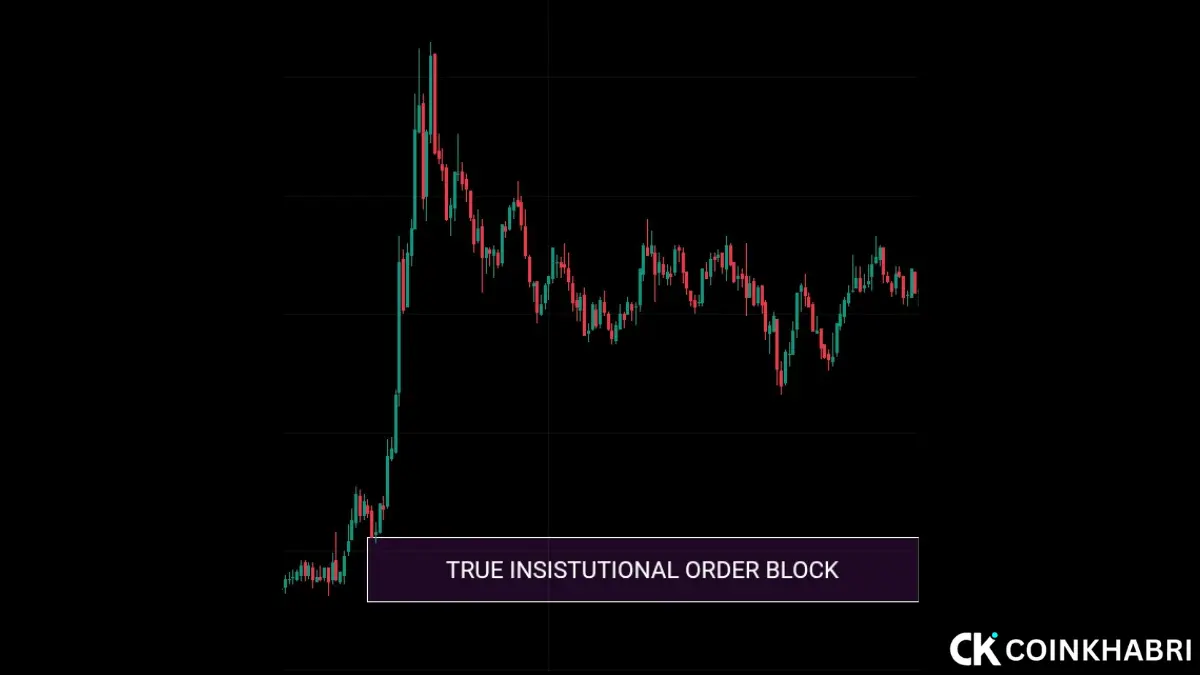
If you have heard this name, you probably also know how it works in trading. If you do not know, you might have seen a chart on Twitter or in some signal group where a drawing-like rectangle shape is made, and on it, it is written “true institutional order blocks.”
However, the problem that retail traders face is that they see the price has reached this point, and they plan a trade. As soon as they plan their trade at the order block, for a short while the price goes in the right direction, but suddenly a wick candle goes all the way down and hits your stop loss (SL).
So, if you also face this same problem and want to know how to identify a true institutional order blocks and how to recognize a real order block, you are reading the exact right guide.
Because in this guide, we are going to explain which order block is perfect for trading—meaning which one is a true institutional order blocks, which one is a fake institutional order blocks, which order block you should take a trade on, and which order block you should not take a trade on. Everything will be covered in detail, along with things that you will not find in every guide.
What is an Order Block in Crypto Trading?
It is very important to understand what an order block is and how it looks, because until you know what an order block is, you will not be able to recognize a true institutional order blocks.
How does an order block look in the market? When you look at the chart, you will see that continuous green or red candles have fallen down or gone up rapidly; that is the order block.
An order block forms in the market because of institutional entry. Meaning, understand it this way: whenever an institution wants to buy or sell any coin, they do not buy or sell directly like you do.
Because if they did that, they would not get the right entry price, which would later cause a loss for the institution. Therefore, the institution first makes all the retail traders buy or sell. As soon as the institution feels that the funds they wanted to buy or sell have been filled, the institution buys or sells right there. As soon as this happens, a sudden spike is seen in the market, which is called an order block, and this is a true institutional order blocks.
Right, one myth is that when the price comes back into that same order block range, it can give a spike again in the same direction. Because of this, retail traders who previously suffered a loss make positions there again, which increases their chances of recovering their loss. Now, how true this is, only institutions or retailers know.
This concept comes from Smart Money Concepts (SMC) and ICT (Inner Circle Trader) methodology, but in crypto, it has its own quirks because the market runs 24/7, order books of altcoins are thin, and most of the “order blocks” you see online are just drawn by indicators, not actual institutional footprints.
Why the Difference Between “True vs Fake” is Important
Not every strong candle is an order block. Not every zone that “worked once” is institutional. Instead, it is very important to know which one is a true institutional order blocks and which one is a fake institutional order blocks.
Trading a fake order block usually has two results:
- The price completely ignores the zone because real size was never there, and your stop loss gets hit.
- The price just slightly touches the zone, which gives you false confidence, and then it sharply reverses because the real liquidity was actually resting somewhere else.
If you understand this concept properly, it also directly connects with broader market sentiment analysis and overall market structure—this is why traders who combine order block analysis with sentiment and fundamentals get much better results than those who trade order blocks in isolation.
Core Difference Between True and Fake Order Blocks
| Factor | True Institutional Order Blocks | Fake / Retail Order Blocks |
| Formation Trigger | Formed after a genuine liquidity sweep (stop hunt) | Formed after random consolidation without a sweep |
| Departure from Zone | Strong, fast, impulsive (displacement) | Slow, choppy, overlapping candles |
| Fair Value Gap | Present, leaves a clean imbalance | Rare or completely absent |
| Volume | Noticeably higher than surrounding candles | Average or low volume |
| Market Structure | Breaks previous high/low (BOS/CHoCH) | No structural break |
| Mitigation Status | Fresh, unmitigated (touched for the first time) | Already tested multiple times |
| Timeframe Alignment | Aligned with the higher timeframe bias | Lower timeframe only, against the HTF trend |
Now let’s understand each point in detail, because just a table won’t be enough for confident trading.
7 Characteristics of a True Institutional Order Blocks
Now you should know the 7 characteristics for identifying a true institutional order blocks, which will be of great help to you.
Forms After a Liquidity Sweep
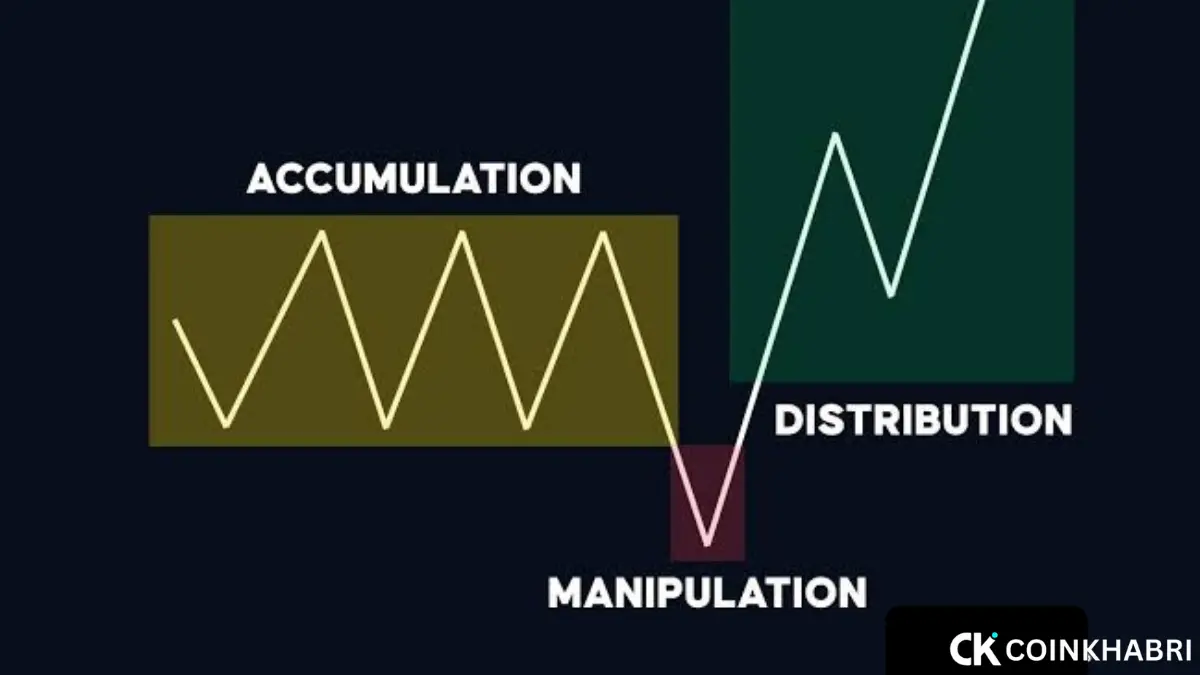
Institutions need liquidity to fill their large orders, and liquidity is where retail stop losses are clustered—slightly above obvious highs and slightly below obvious lows. Before a genuine order block forms, you will almost always see the price violently wick through an old high or low, trigger those stop losses, and then snap back.
If the “order block” you are looking at had no clear stop hunt or liquidity grab before it, remain skeptical.
Followed by Displacement
Displacement means a sharp, aggressive, mostly one-directional move away from the zone. Real institutional buying or selling creates an imbalance in the order book that price cannot fill efficiently, which is why price moves fast, often passing through multiple swing points in a single leg.
After a true institutional order blocks candle, usually 3 to 5 strong candles come in the same direction where pullbacks are very low. If price crawls slowly and there are a lot of overlapping wicks, the “order block” you marked is probably just noise.
Leaves a Fair Value Gap (Imbalance)
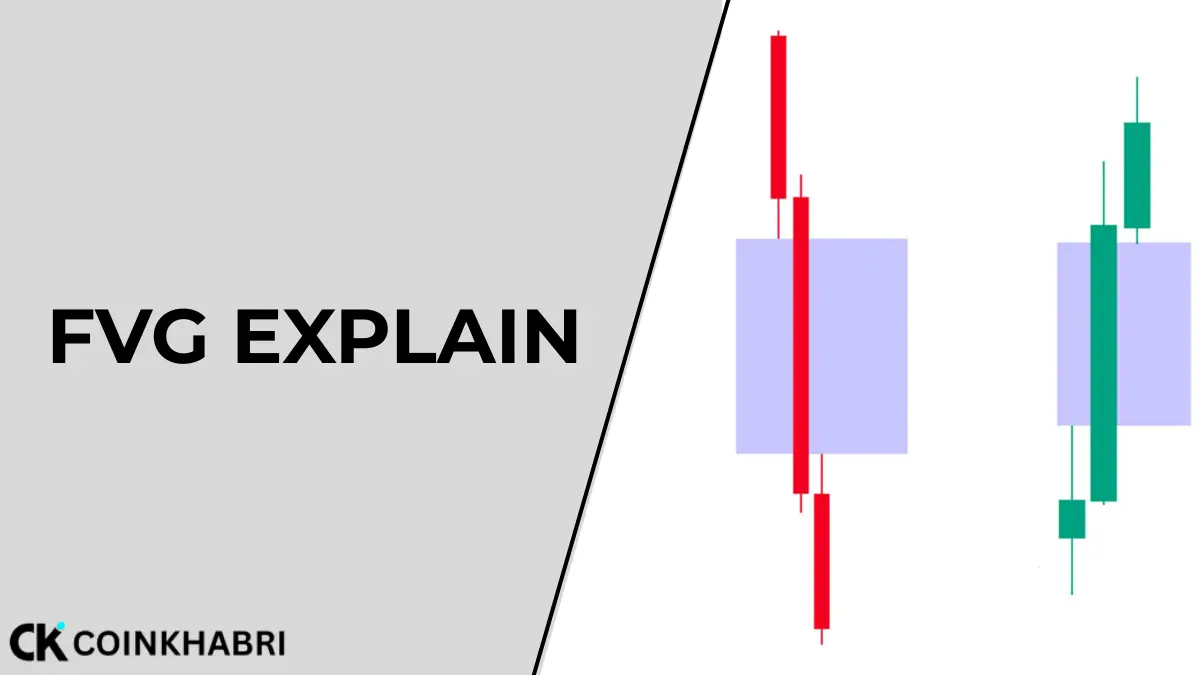
When displacement happens, a Fair Value Gap (FVG) is usually created—this is a three-candle pattern where the first candle’s wick does not overlap with the third candle’s wick. This gap represents inefficient delivery of price, and price usually comes back to fill part of that gap before continuing in the original direction.
Almost always, there is at least one FVG directly above or below a genuine true institutional order blocks. If there is no imbalance at all, the zone is weak.
Causes a Break of Structure (BOS) or Change of Character (CHoCH)
For an order block to matter, it is necessary that the move away from it actually changes market structure—breaking the previous swing high in an uptrend, or the previous swing low in a downtrend. This confirms that real directional intent entered that zone, not just a temporary bounce.
If price moves away from your marked zone but no meaningful structure breaks, that “order block” is not institutional—it is just local supply or demand.
Volume Confirms It
This is the step that many crypto traders skip. Check the volume histogram (or better yet, the volume profile / footprint tool) on the candle you are marking as an order block. A true institutional zone almost always shows a volume spike compared to surrounding candles, because real size was traded there.
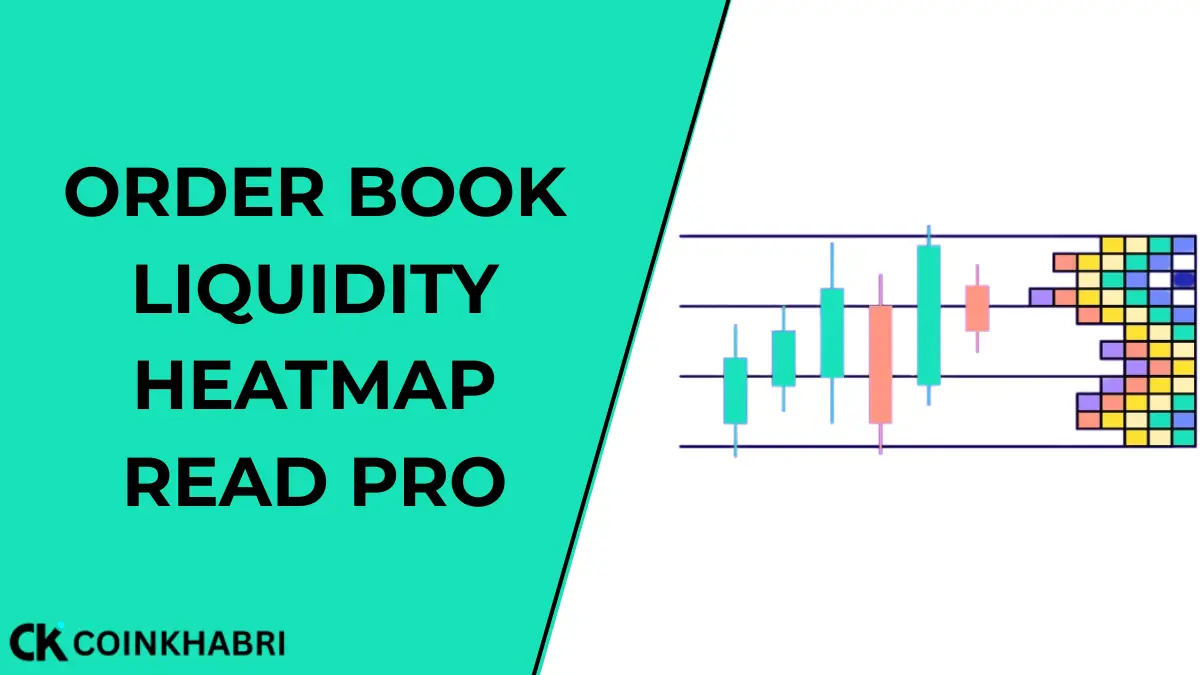
On exchanges like Binance, Bybit, or OKX, you can also cross-check this using the order book heatmap or aggregated trade data—extra clusters of resting limit orders near your marked zone give extra confirmation.
Fresh and Untested
Order blocks are like bank vaults—once the money is taken out, there is nothing left to protect. When price returns to a genuine order block for the first time, a strong reaction comes because unfilled institutional orders are still resting there. Every time price visits that same zone again, the reaction keeps getting weaker because more orders from it have been filled.
If an “order block” has already been tapped three or four times and is still being marked as valid, it is almost certainly mitigated and no longer reliable.
Aligned with Higher Timeframe Bias
A true institutional order blocks on a 15-minute chart should generally agree with the trend and structure of the 4-hour or daily chart. Institutions build their positions gradually across multiple timeframes, so a real zone has some confluence—like a 15m bullish order block during an overall uptrend being inside a 4H demand zone.
Order blocks that only appear on low timeframes and go completely against the higher timeframe trend have a much higher chance of failing.
5 Red Flags of a Fake Order Block
- No liquidity sweep happened beforehand. If the price simply drifted into the zone without grabbing any stops, it is probably not institutional.
- No displacement afterwards. Slow and choppy movement away from the zone is a sign of retail activity, not smart money.
- The zone has been tested multiple times. A box that has “worked” five times does not prove its strength, but rather proves that the unfilled orders have run out.
- Drawn purely by an automatic indicator. Many free “order block indicators” mark every swing high/low candle as a block. They have no concept of liquidity, volume, or displacement—they are just pattern generators, not institutional footprint detectors.
- Being promoted in a signal group. Be extra careful with those paid Telegram or WhatsApp groups that claim guaranteed reversals in the name of order blocks—these use the exact same tactics found in fake signal groups, which is important to understand on its own.
Step-by-Step: How to Identify a True Institutional Order Blocks
- Zoom out first. Check the daily and 4H chart to understand the overall trend and major liquidity (old highs/lows, equal highs/lows).
- Wait for a liquidity sweep. See that the price wicks through an obvious high or low and then sharply rejects.
- Mark the last opposite candle before the impulsive move that comes after the sweep.
- Confirm displacement. The move away from the zone should be fast and strong, ideally breaking recent structure.
- Check for the Fair Value Gap left behind by that displacement.
- Verify with volume. Compare the candle’s volume with surrounding candles, and if the exchange allows, check the order book as well.
- Confirm that the zone is fresh. Trade only the first return to the zone, not the third or fourth.
- Match it with the higher timeframe bias. Take the setup only when the lower timeframe zone agrees with the bigger picture trend.
- Set invalidation properly. If the price closes through the block with strong volume, the zone has become invalid—exit or avoid the trade in the hope that it will hold.
A Practical Example
Imagine BTC is in an uptrend on the 4H chart. Suddenly, the price wicks below a recent swing low, sweeping the stop losses of everyone who placed their stop right beneath that level—a classic liquidity grab. Within the next few candles, the price reverses hard, breaks above the previous swing high with strong volume, and leaves behind a clean Fair Value Gap on its way up.
The last bearish candle before that impulsive move is a strong candidate for a true institutional order blocks. If the price returns to that exact candle’s range for the first time, holds, and shows rejection with volume, this is a much higher-probability setup than buying any random green-to-red candle on a lower timeframe chart.
Now, compare this to the scenario where BTC just consolidates sideways, coincidentally one candle is a bit larger than the rest, and some automatic indicator marks it as an “order block” without any sweep, displacement, or volume spike. This is the fake version—and it is far more common on retail charts than the true version.
Conclusion
The purpose of this entire article is simply that an order block exists, but recognizing it is not something everyone can do. Whoever identifies a true institutional order blocks on the chart can make a good amount of money in trading. And if you have read every single point of this guide carefully, you will definitely make money from order blocks.