How to Read Crypto Liquidity Heatmap & Order Book Like a Pro
Professional traders use the order book and liquidity heatmap together on the exchange to make their entry, and beginner traders do not even know what an order book is or what a liquidity heatmap is.
Professional traders use the order book and liquidity heatmap so that they can find out where smart money or institutions are entering, and then they also enter alongside the smart money and make money.
If you are a beginner trader or you just take entries by looking at candlestick charts, you can significantly improve your trade accuracy by using the order book and liquidity heatmap.
By the end of this guide, you will know what an order book is, what a liquidity heatmap shows, how to read both like a professional trader, which tools are best in 2026, and the mistakes that cause beginners to lose money.
What is a Crypto Order Book?
An order book is a live and constantly updating list that shows all the buy and sell orders for any trading pair (such as BTC/USDT or ETH/USDT). Every order book is divided into two sides:
- Bids (Buy Orders): Traders who want to buy the asset are listed from the highest price downwards. These are usually shown in green color.
- Asks (Sell Orders): Traders who want to sell the asset are listed from the lowest price upwards. These are usually red.
The gap between the highest bid and the lowest ask is called the Spread. If the spread is tight, it means the market is highly liquid and efficient. If the spread is wide, it means low liquidity, high volatility, or it could be an illiquid altcoin pair.
Basic Order Book Terms Every Beginner Should Know
- Market Depth: How many buy and sell orders exist at each price level. A deep market can absorb large trades without moving the price too much.
- Order Book Wall: A very large single buy or sell order at a single price level that can temporarily stop the price from moving past that level.
- Liquidity: How easily an asset can be bought or sold without having a major impact on the price.
- Spoofing: Placing a fake large order to trick other traders, then canceling it before it gets filled. This is illegal on regulated exchanges, but still common on low-liquidity pairs.
- Iceberg Orders: Very large orders that are deliberately split into smaller pieces so they do not look like a giant wall and do not alert the market.
Understanding these basics is necessary before moving on to the heatmap, because a Liquidity Heatmap is actually just a visual and historical representation of order book activity.
What is a Crypto Liquidity Heatmap?
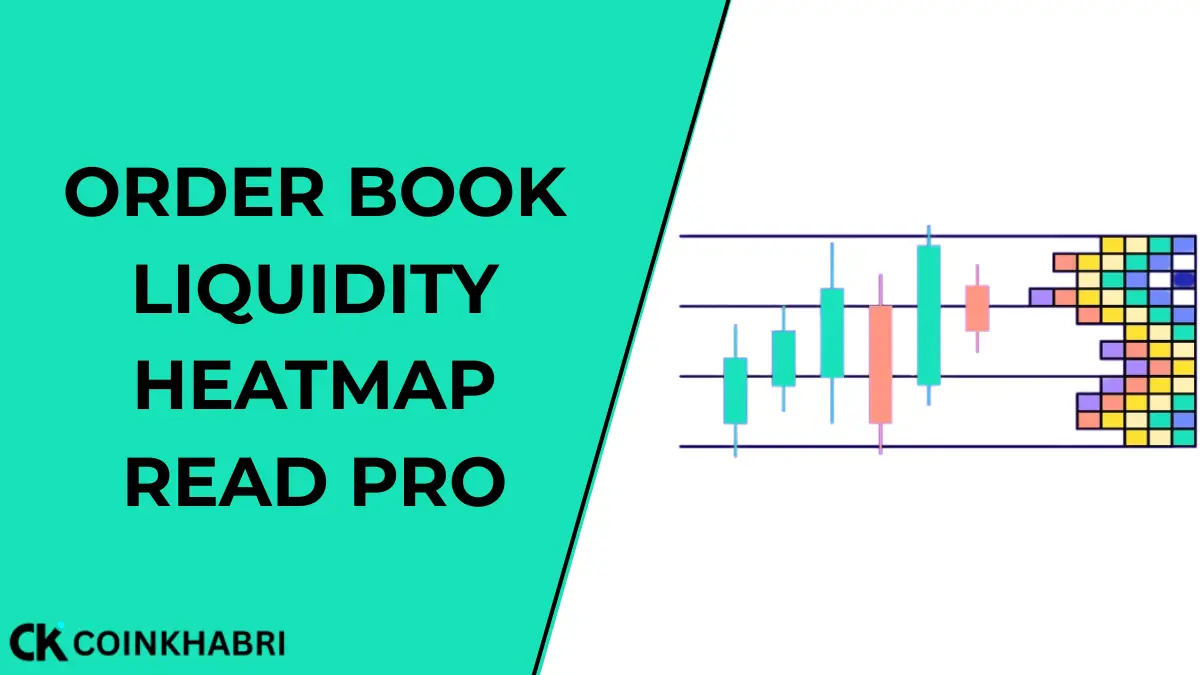
A liquidity heatmap takes raw order book data and plots it over the price chart using color intensity. Instead of scrolling through rows of numbers, you see color clusters at specific price levels — the brighter or more intense the color, the larger the pool of buy or sell orders present at that price level.
This instantly gives you a visual answer to the question every trader asks: “Where is the real liquidity sitting, and which direction is the price more likely to be pulled toward?”
Beginners often confuse two different types of heatmaps, and understanding the difference between them will put you ahead of 90% of new traders:
| Type | What It Shows | Based On What Data |
| Liquidity Heatmap (Order Book Heatmap) | Live resting limit orders currently present in the order book — where actual buy/sell walls are positioned | Spot and futures order book depth |
| Liquidation Heatmap | Estimated price zones where leveraged futures positions are likely to be force-liquidated | Open interest, leverage, and funding data |
Both are useful, but for completely different reasons. An order book liquidity heatmap shows where resting orders currently are, whereas a liquidation heatmap shows where forced selling or buying is likely to happen if a certain price is hit. Professional traders often use both together.
How to Read a Liquidity Heatmap Step-by-Step
- Open the heatmap alongside the live price chart. Most platforms overlay the heatmap directly onto the candlestick chart so you can see price action and liquidity together.
- Identify the brightest color zones. These are the price levels where the most resting orders are concentrated — they are also called liquidity pools or magnet zones, because the price is often pulled toward them.
- Separate bid-side liquidity from ask-side liquidity. Bright zones below the current price usually show buy-side support; bright zones above the price usually show sell-side resistance.
- Watch how the color moves when the price gets close to that zone. If a liquidity wall disappears right before the price reaches it, it is usually a sign of spoofing or an iceberg order being consumed.
- Cross-check with volume and trend. A liquidity zone behaves completely differently in a strong uptrend compared to a zone in a range-bound or declining market.
- Understand timeframes and use them accordingly. A heatmap built on 5-minute data is useful for scalping; a heatmap built on daily data is more useful for swing and position trading.
Professional order-flow traders follow a simple rule: price is pulled toward liquidity like a magnet, and once that liquidity is absorbed, price often reverses sharply. This is why strong reversals happen so often right after liquidity sweeps near visible heatmap zones.
Best Liquidity Heatmap & Order Book Tools in 2026
If you are thinking that you need expensive software to read a liquidity heatmap or order book, it is not like that; you can read it for free, and below are the tools talked about that most traders use.
- CoinGlass — The most popular free option, which provides real-time order book liquidity heatmaps, liquidation heatmaps, open interest, and funding rate data across more than 30 exchanges.
- Hyblock Capital — Institutional-grade heatmaps that provide leverage-weighted liquidation and liquidity data, popular among futures traders who calculate their position size carefully.
- Bookmap — A dedicated order flow visualization tool built specifically for reading depth-of-market and order book heatmaps in real-time.
- TensorCharts — Offers detailed order book heatmaps that are directly layered with volume and open interest.
- Exchange-native tools — Binance, Bybit, and OKX have their own built-in order book depth charts, which are enough for beginners who are not yet ready for paid platforms.
How to Actually Use This Data in Your Trading Strategy
Reading the heatmap is only half the battle for a trader; how to use it correctly is explained below.
- Use the heatmap to mark major liquidity zones above and below the current price.
- Instead of taking an early entry, wait for the price to sweep that zone. Liquidity is often “grabbed” before the real move happens.
- Look for a reaction — a strong rejection candle, a sudden volume spike, or a fast wick through the zone followed by a reversal.
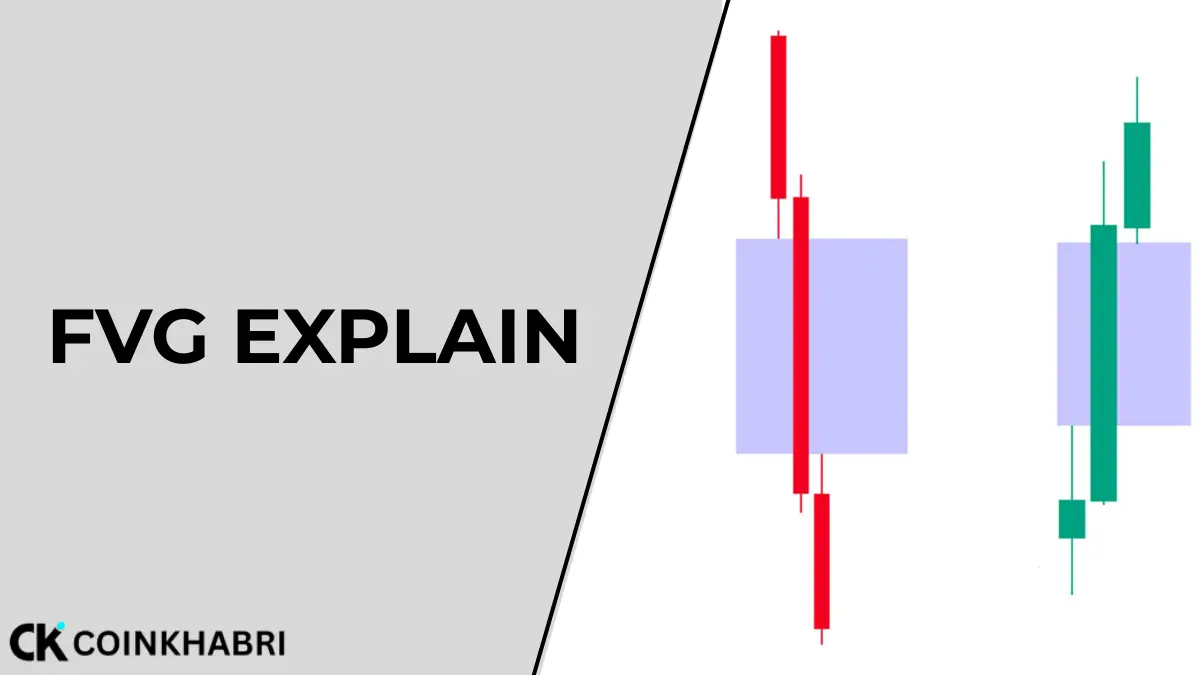
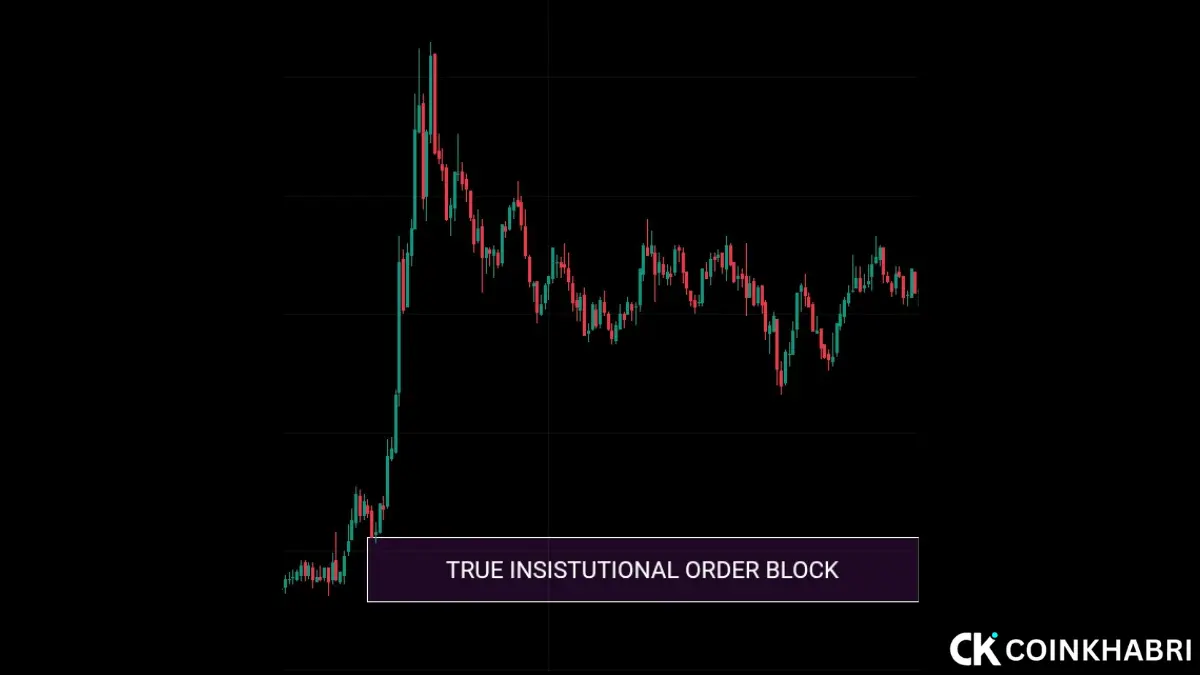
- Combine it with market structure. A liquidity sweep that also aligns with a genuine institutional order block or fair value gap is a much stronger signal than either of them alone.
- Define your risk first. Liquidity zones are areas of probability, not a guarantee. Never enter a trade without knowing your invalidation point — especially on leveraged futures positions, getting this calculation right is a skill in itself.
Combine Order Flow With the Bigger Picture
Order books and liquidity heatmaps work best when they are understood as one layer of a complete trading process, rather than a standalone signal. Before sizing a trade around a liquidity zone, it is better to first check the overall market mood through proper sentiment analysis, understand whether Bitcoin dominance is currently moving toward majors or altcoins, and confirm that the setup aligns with genuine institutional order blocks rather than fake ones. If you are trading futures, always calculate your liquidation price manually before taking an entry, and be honest with yourself about risk.
Most traders lose money in their accounts not from a wrong heatmap read, but from bad risk management. For scalpers especially, pairing heatmap zones with fair value gaps on lower timeframes gives much cleaner entries than either tool alone. And once your strategy starts giving consistent trades, properly tracking your portfolio becomes just as important as the entries.
Conclusion
Order books and liquidity heatmaps are not magic indicators that predict the future — they are a map that shows where real money is sitting in the market right now. Learning to read this map takes time, but once it clicks, you will never look at a candlestick chart the same way again.
Start small, use free tools, combine what you have learned here with sound risk management, and let your reading skills improve by reviewing every trade.